1-0 Student Survey
Sophia University has conducted the ”Attitude Survey for Freshman Entrance” at the time of enrolment, the “Fact-finding Survey on Student Life” for current students in their second year or above, the “Graduate Feeling of Growth Survey” to measure their sense of growth at the time of graduation, and the ”Alumni Survey” to find out the actual status of graduates since 2022.
Attitude Survey for Freshman Entrance 2022
The results of the “Attitude Survey for Freshman Entrance” were collected from new students who enrolled in faculties in April 2022. The results of the survey are shared with the university’s Executive Board, faculties, student support departments, ICT departments, facilities departments, libraries and other departments for consideration, including teaching and learning policies, countermeasures against the new coronas, and the development of the online teaching environment.
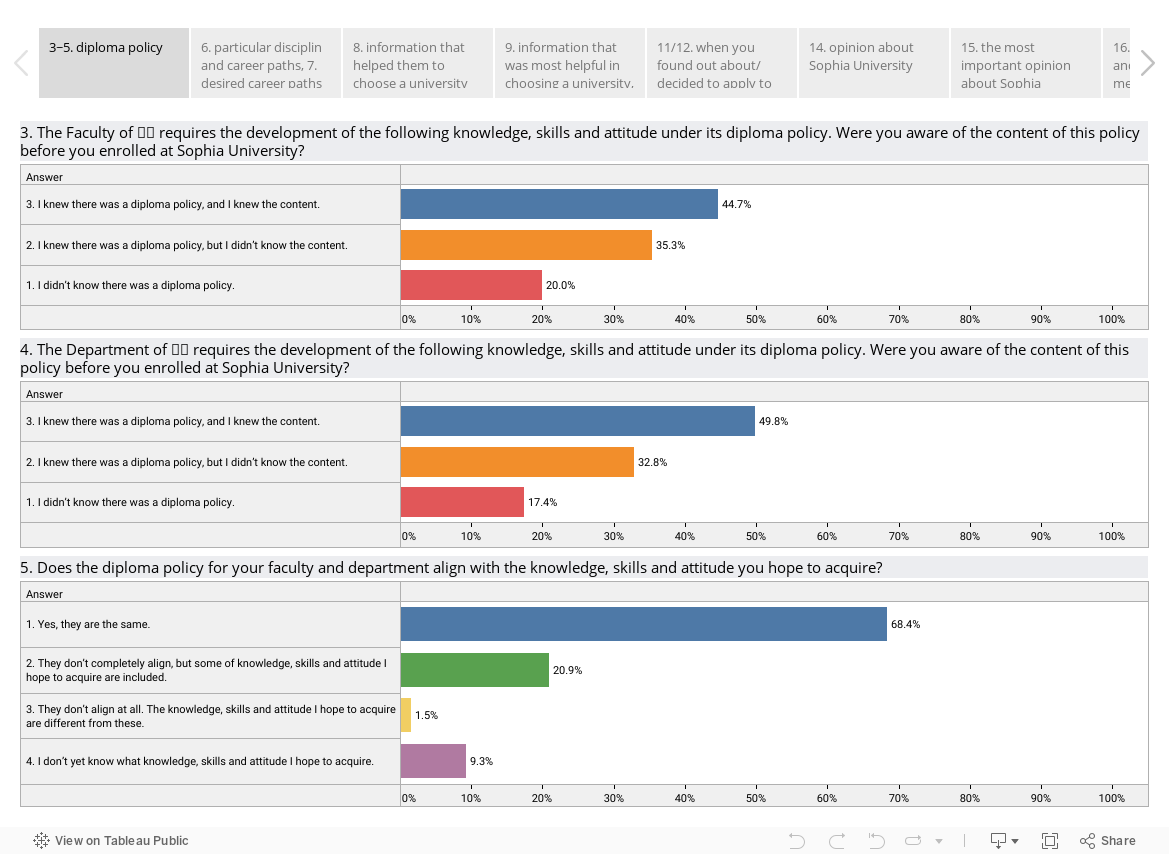
Diploma Policy (hereinafter DP)
Q3-5: The level of awareness of the DP tended to be high for both faculties and departments prior to enrolment. The results also showed that most of the new students wanted to acquire the abilities set out in the DP when they selected “Yes, they are the same.” and “They don’t completely align, but some of knowledge, skills and attitude I hope to acquire are included.” in terms of the degree to which the DP and their sense of self matched.
University selection
- Q8-10: ‘Websites’ and ‘Brochure’ were the most useful information in selecting a university. The majority of respondents use ‘Smartphone’ as a tool for obtaining information, but this does not mean that they only use smartphones, with around a quarter using PCs.
- ‘Q14’ New students gave high marks to ‘campus location and surroundings’ and ‘study abroad environment’.
- ‘Q15-17’ The most common reason for enrolment was ‘I can study the academic discipline I want.’, but when it came to questions about the field of study and how to study it, the most popular response was ‘The language education is substantial.’.
University life
- When asked about what they would like to focus on in their future university life (Q20/21), the results, including “Definitely yes” and “To a certain extent”, indicate that they would like to focus on a variety of things. When asked what they would like to focus on most, the most common answer was ‘Study a specialized field’.
- Q22: The question on anxiety about student life revealed that an extremely large number of new students were worried about their ability to keep up with their classes. Also many new students were worried about making friends.
Career path after graduation
- The most common response to Q6/7, the relationship between specialisation and career path, was ‘I hope to get a job directly related to my field of study, but other type of work is also acceptable.’.
- Students were strongly inclined to work for a company as their preferred career path, but many students also said they were undecided.
Surveys conducted in the past.
Report of Student Survey from 2019 to 2021
We announce the findings from our freshman and upper-class student surveys for the academic year (AY) 2019-2021 which you all kindly supported.
Due to the COVID-19 pandemic, the campus life for students during AY2020 differed greatly from what they had envisioned before they entered the university. This resulted in a low level of fulfillment and satisfaction with student life among new students. For AY2021, while some responses say that the situation has returned to the previous status quo, we have seen others that say otherwise.
The survey results and the content of the free-response sections will be shared with the university’s executive committee, each faculty, student support division, ICT division, facilities division, library, and other divisions, and will be used to discuss teaching and learning policies, COVID-19 countermeasures, and the development of an online class environment.
Until AY2019, we distributed and collected questionnaires in class. However, since AY2020, we have switched to online questionnaires, resulting in some differences in the number of responses and response rates.
【AY2019】All departments are invited to participate in this program, focusing on the required courses in the departments with the most students. Paper surveys are distributed and collected during class.
Freshman Survey Responses : Responses 2,035 79.5%
Upperclass Student Survey : Responses 2,626 60.4% (For juniors and seniors)
【AY2020】Web Surveys with Survey Monkey
Freshman Survey Responses : Responses 685 24.2%
Upperclass Student Survey : Responses 659 10.6% (For juniors and seniors)
【AY2021】Web Surveys with Survey Monkey
Freshman Survey Responses : Responses 405 14.0%
Upperclass Student Survey : Responses 828 8.9% (For sophomores, juniors, and seniors)
*During the COVID-19 pandemic, we felt it was important to grasp the situation of the freshman students in AY2020, so in AY2021, a survey was conducted on second-year students using questions from the upper-class survey.
Inquiries about the
contents of this page
- Department Name
- Institutional Research